
K-partite, Bipartite … What is it ?
Most of the time, when you create a graph, all the nodes are representing the same « kind » of object.
- In a Social Network : Persons
- In a Route Netowork : Stops, Airports, Stations etc…
- In a Geographical Network : Countries
But sometime, depends on your graph modelisation, you will encounter a graph that will have 2, 3 or multiple « kinds » of nodes where the links are almost exclusively going from one type to the other. These graphs are called Multipartite Graphs.
- If you have 2 kinds of nodes, it’s a Bipartite Graph (or 2-partite)
- Example : Social Network : Persons <-> Companies
- If you have 3 kinds of nodes it’s a 3-partite Graph
- Example : Movie Network : Actors <-> Movies <-> Directors
- If you have k kinds of nodes it’s a k-partite Graph
If you want a proper scientific definition, Wikipedia will be your friend.
The Dataset
To illustrate this thema, we will use a well know dataset : The Cac 40 Administrators relationship from www.citoyennumerique.fr.
Please, feel free to play with the graph. I provide you the gexfs here Tuto_Multitpartite_CAC40 . The tutorial will be based on the SimpleGraph, but I also give you the FullGraph to play with.
How the graph is build ? Well, a company has several administrators and nothing prevent an administrator to be in multiple companies, so we build a directed graph where companies are sources of edges and targets are the administrators.
I’ll focus on the technics and metrics. I let yourself think about the ethics and politics 😉 .
If you follow, this is a typical bi-partite graph. If you look on the data, part of the node has a property type Administrator and the other part has a property type Company.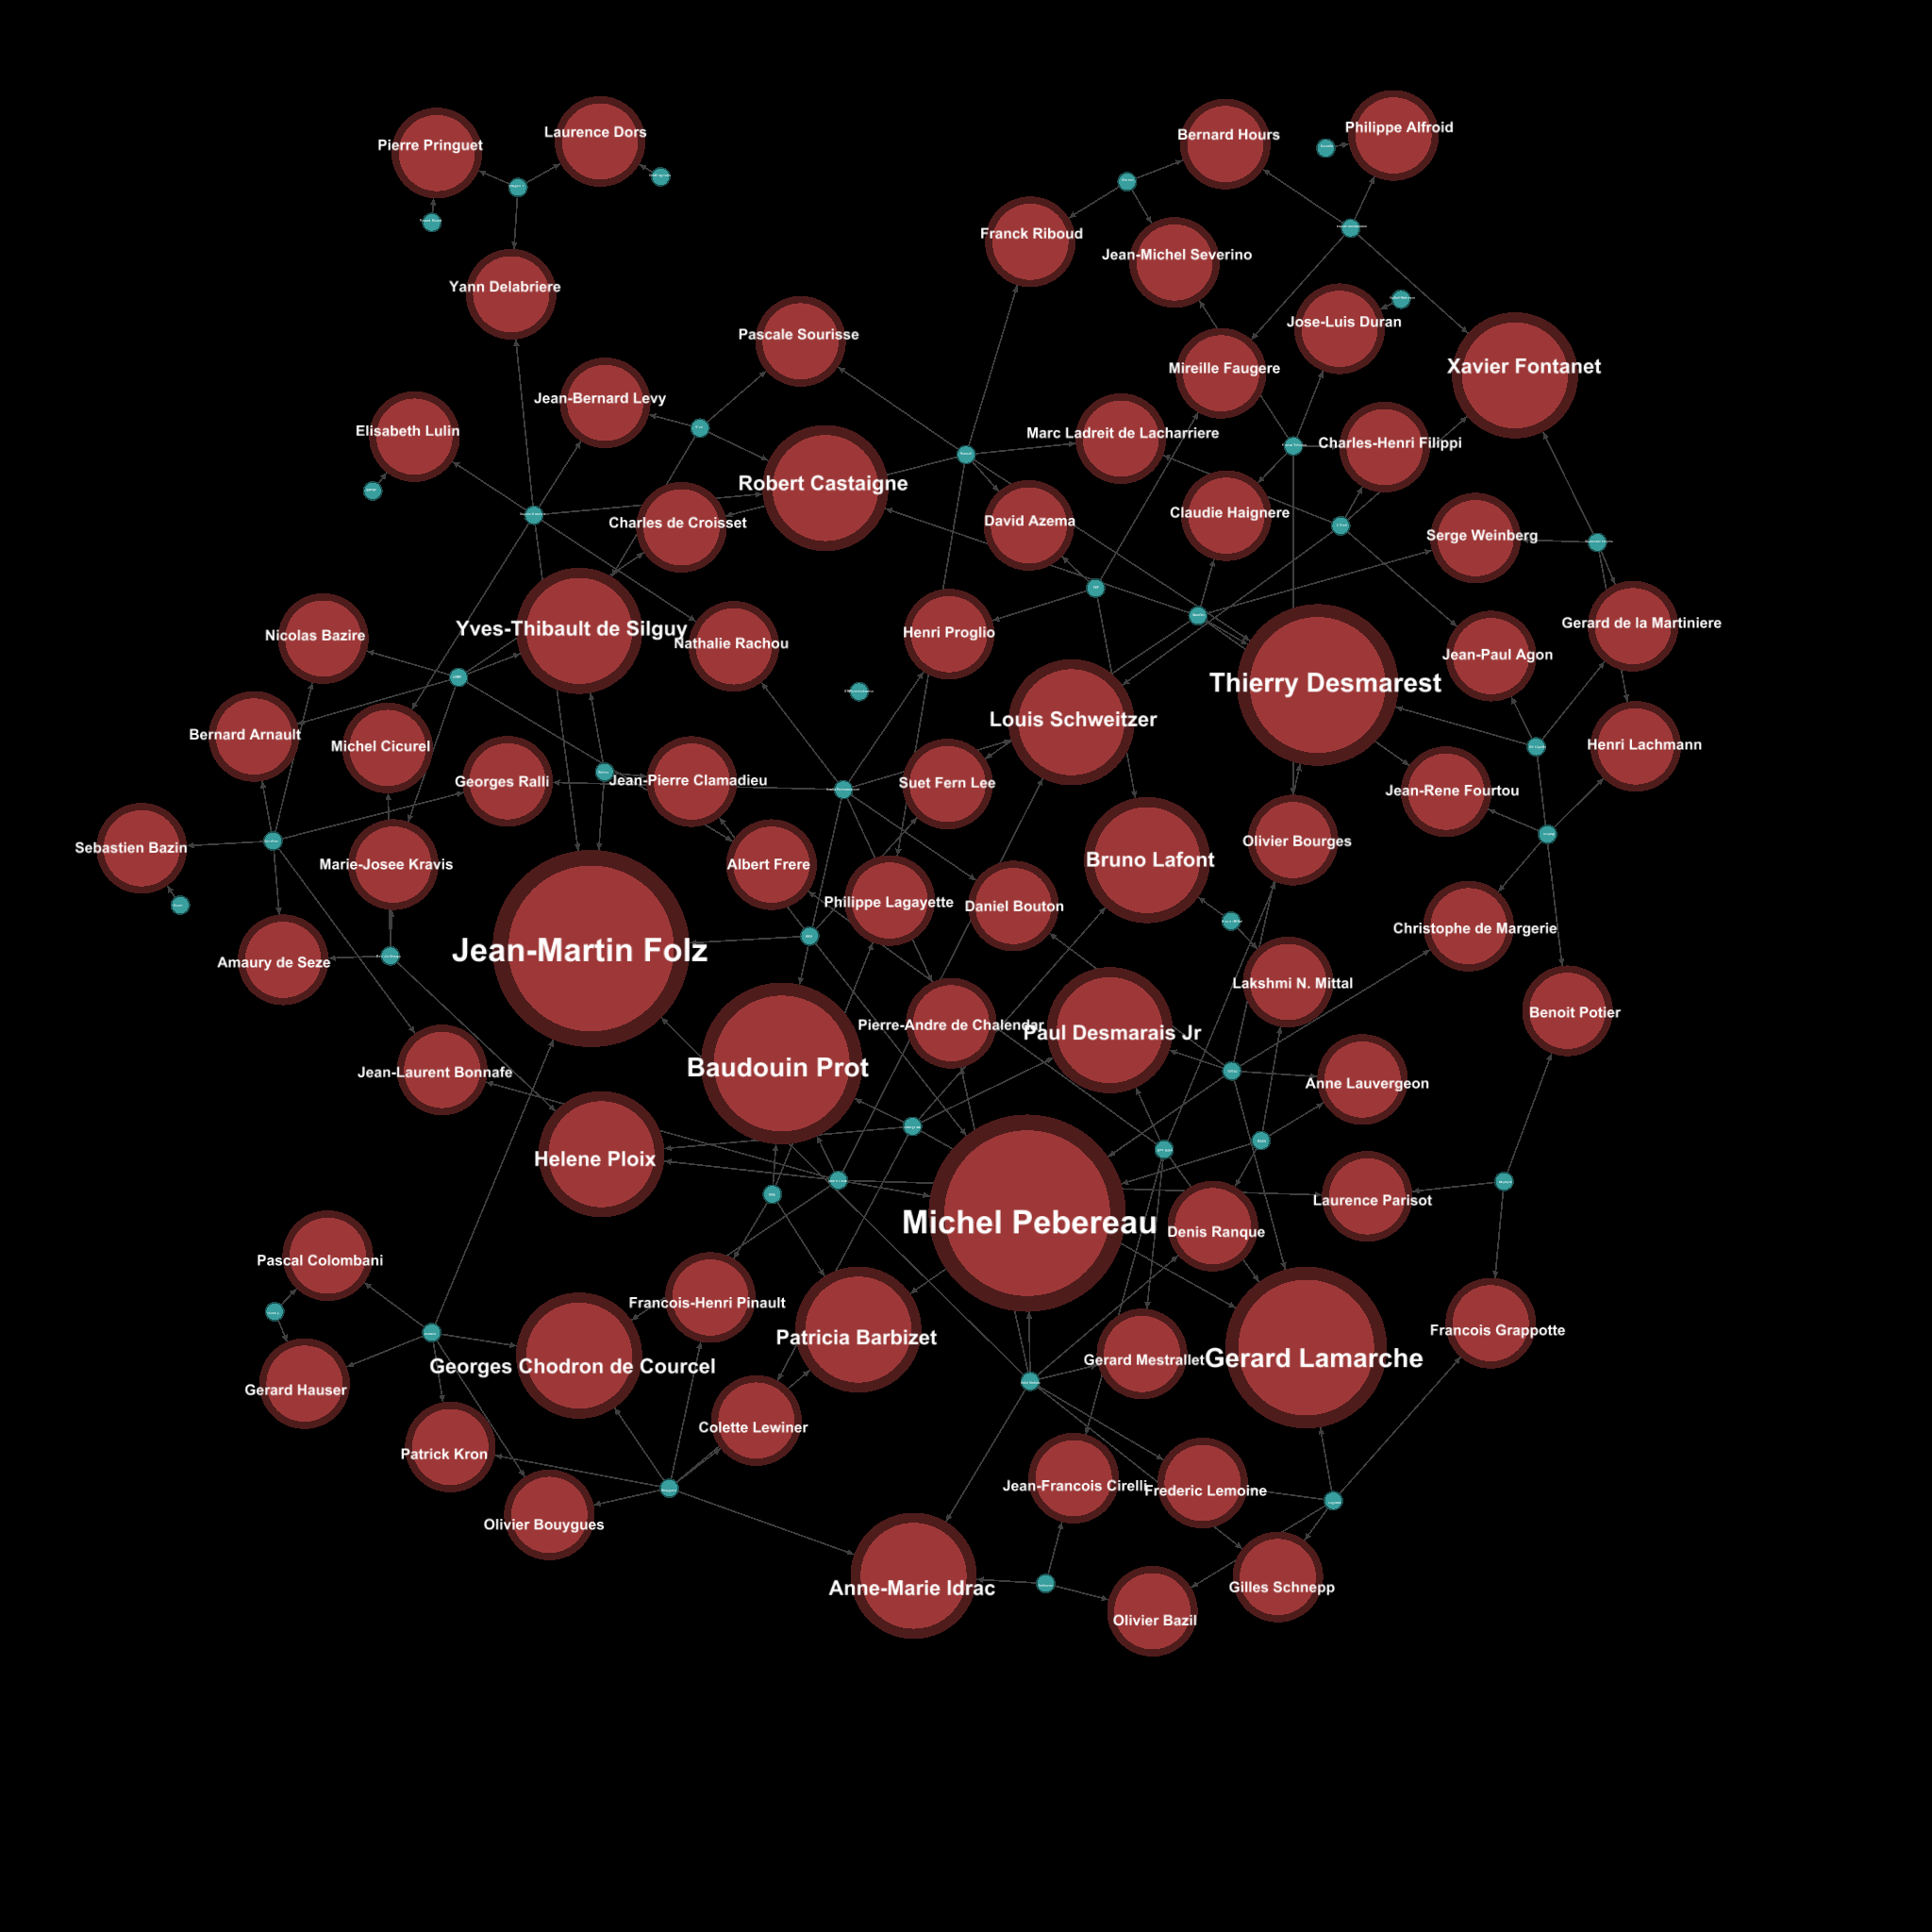
It’s already nice and we can get quick obesvation:
- Filtering by InDegree, we can check that Michel Pebereau and Jean-Martin Folz are in 5 companies at the same time.
- Filtering by OutDegree, we can check that St-Gobain and Total have 8 administrators that are in other companies.
But that could be done without graph, an ordered list on excel would have done the job.
How to deal with multipartite graphs ?
It feels that it’s not very convenient to get something out of this, and even the interpretation of metrics isn’t easy. That’s because the graph is mixing different notions (type) which makes it a little difficult to read and analyse.
So what to do ? There isn’t official methodology, but we can use some trick to improve the readability. The easiest one is to reduce the bi-partite graph in a mono-partite graph.
By reducing, we will « lose » information but we gain in readability and synthesis, that’s part of the work in datavisualisation to see at which level we want to go and how to deal with this trade of information. This will mostly be driven by the question you want to answer.
The principle of the reduction is to concider some nodes as edges and deduce a new graph based on this rule. In our example we have 2 ways to go :
- Either we decide that the nodes of type « Company » are the edges. It will generate a graph of « Persons «
- Either we decide that the nodes of type « Person » are the edges. It will generate a graph of « Company «
Here both graphs generated makes « sense » (network of entities) but it can appears that one of the graph isn’t really meanful. That’s part of your work to juge this aspect.
Now, how to perform the transformation ?
Using a Plugin
The easiest way would be to use the Multimode Network Transformation. The plugin is available on the gephi app market and in the plugin manager in Gephi.
When it’s installed, you should be able to see or display the Multimode Network Transformation tab.
Then, load the graph your are interested in, clone it in a new workspace and :
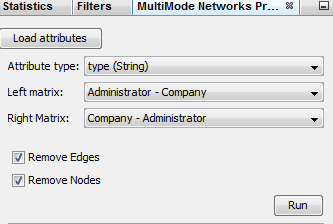
- Click on Load Attributes and select Type on Attribute Type.
- For left matrix select « Administrator – Company » and right matrix « Company – Adminstrator«
- Enable Remove Edges and Remove Nodes, and Click Run
 The plugins will actually to transform each relation like:
(Administrator)<—(Company)–>(Administrator)
to
(Administrator)<-[{weight=Nb of Common Companies}]->(Administrator)
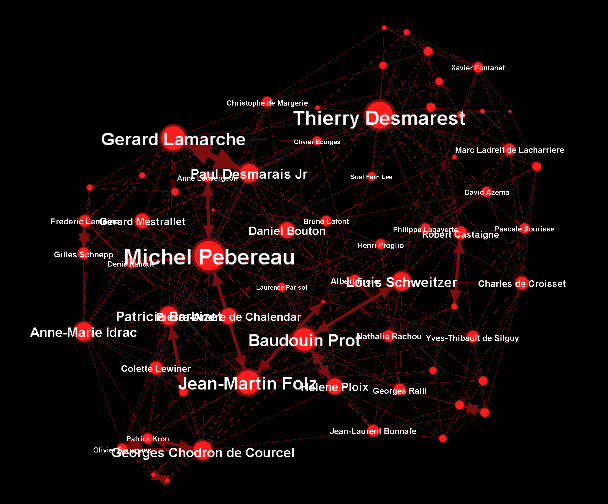
Now you should have a graph with only administrators on the graph preview.
To generate the relation between companies, replay the same steps from the original graph (duplicate the workspace0 again) and in the Multimode Network Transformation use :
- Left Matrix : Company – Administrator
- Right Matrix : Administrator – Company

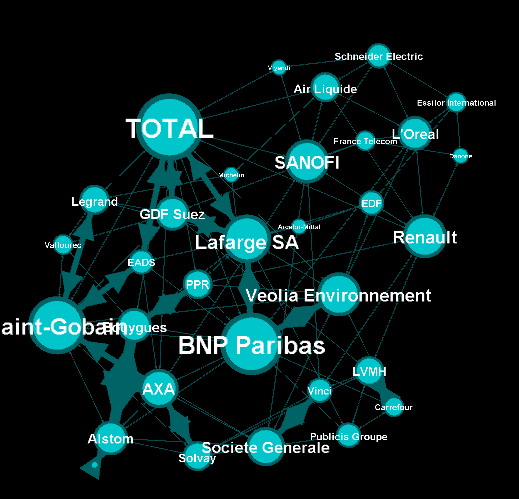 With the 2 new graphs, we are able to see some particularities:
- The maximum of common administrator between company is 3 : Bouygues and Alstom with Olivier Bouygues, Patrick Kron, Georges Chodron de Courcel
- Half of the companies are sharing at least 2 administrators .
- The maximum of common company between person is 3 : Gerard Lamarche and Paul Demaray Jr see each other when Total, GDF Suez and Lafarge SA have a meeting with Board of Directors.
- From all administrators that are in at least 2 companies, 1/3 of them are at least in the same 2 companies.
These statements can be deduced from the original graph, but wasn’t obvious. With the 2 generated graphs, it makes easy to see it.
The works now is mostly to look at graphs, and resume all the particularities within a production (poster, interactive graph, newpaper writting etc…)
Limitations
The plugin works quite well, but sometime it has some limitation on large graph. Or sometime you may want to reduce your graph and have a custom metric computed. Then the only alternative to that is to use a script that will generate you the graph.
Conclusion
Multipartite graph are complex to analyse, but reducing it to monopartite graphs gives you more vision to get insight about your data.