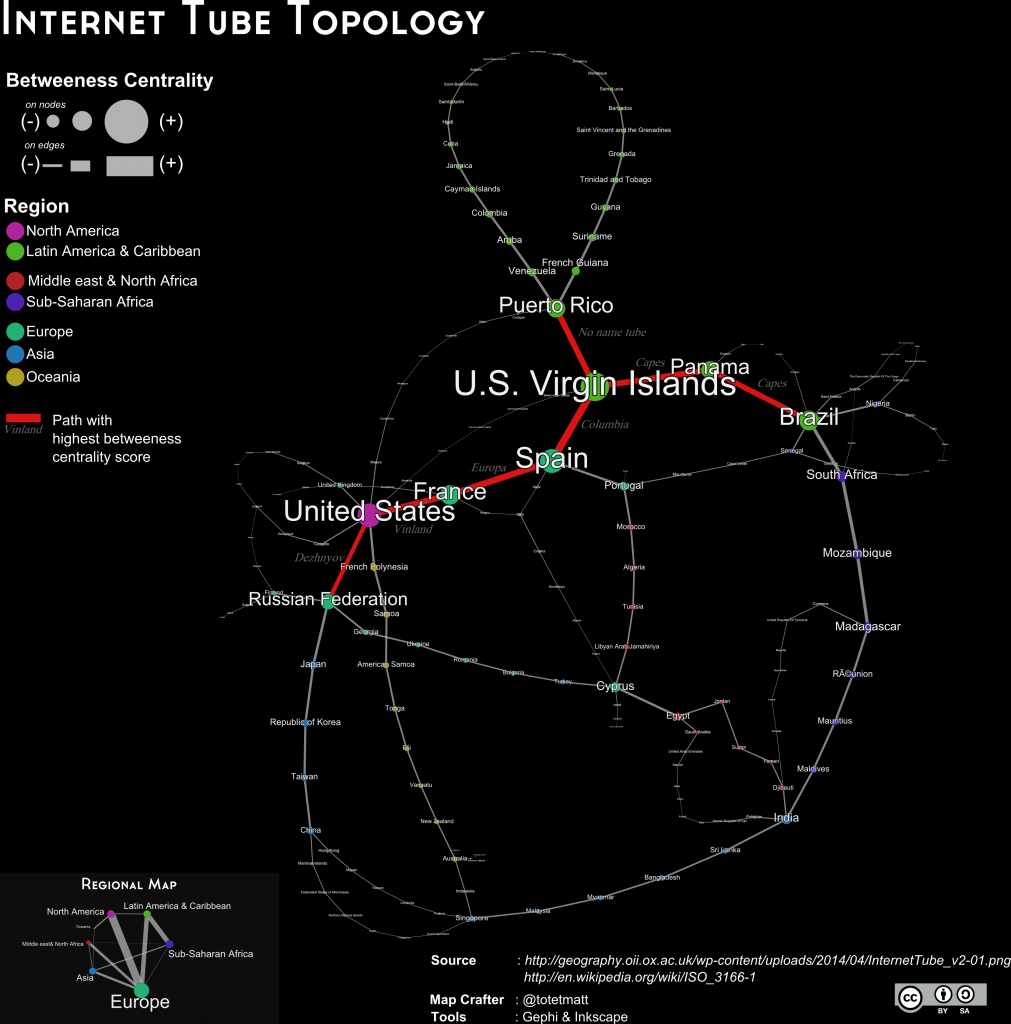
This graph represent the map created recenlty by http://geography.oii.ox.ac.uk/ which represent the internet tube as a metro line. The « abstract representation » made here is conveignent because this simplification of the fiber-optic network makes very easy to quickly turn into a graph. And with this graph representation, we are now able to use our traditional tools and metric to analyse the network.
You can also download the gexf version
What can we say ?
Well, keep in mind that’s here we are looking at a simplificaiton of the submarine network of fiber-optic cable used for internet. Moreover, we don’t even have any information about some important parameter (like the bandwith or « speed of cable ») which can be very influents parameter for internet usage.
We are looking the topology of the submarine network. I ran 2 metrics : Betweeness Centrality for Nodes and Edges which shows us, as a topology point of view, what are the countries and the « roads » the most used if you want to go from one point to another in the network with the shortest path.
Most visible is the importance of Porto Rico, which is the only access point for many countries (most of central & south american ).
The red line can be define as the spinal of internet, it represents the 7 most used paths and the 8 most central countries in the overall network.
Keep in mind that it’s a pure topology analysis, and it doesn’t represent the current usage of internet. What would be interesting is to add more technical information or statistics on the usage of theses roads to redo the same kind of analysis based on real and complete data.
I also didn’t report the ennemy of internet as the Oxford version did it. Could be interesting to spot where are exactly the country.

