Servus !
Just a quick post for some scripts that will allow you to visualise in real-time bitcoin transactions, thanks to https://blockchain.info/ web service.
Prerequisites :
- Gephi with the Streaming Plugins
- Python installed
You can download a version of the scripts with all the libraries embeeded : http://matthieu-totet.fr/bitcoin.zip
A git repo exists here for the scripts only : https://github.com/totetmatt/gephi-bitcoin
How does it works ?
- Open Gephi, create a new project and Start the master server in the Streaming plugin.
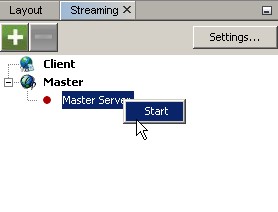
- Download the zip here and unzip it on you computer where you want.
- Execute a script :
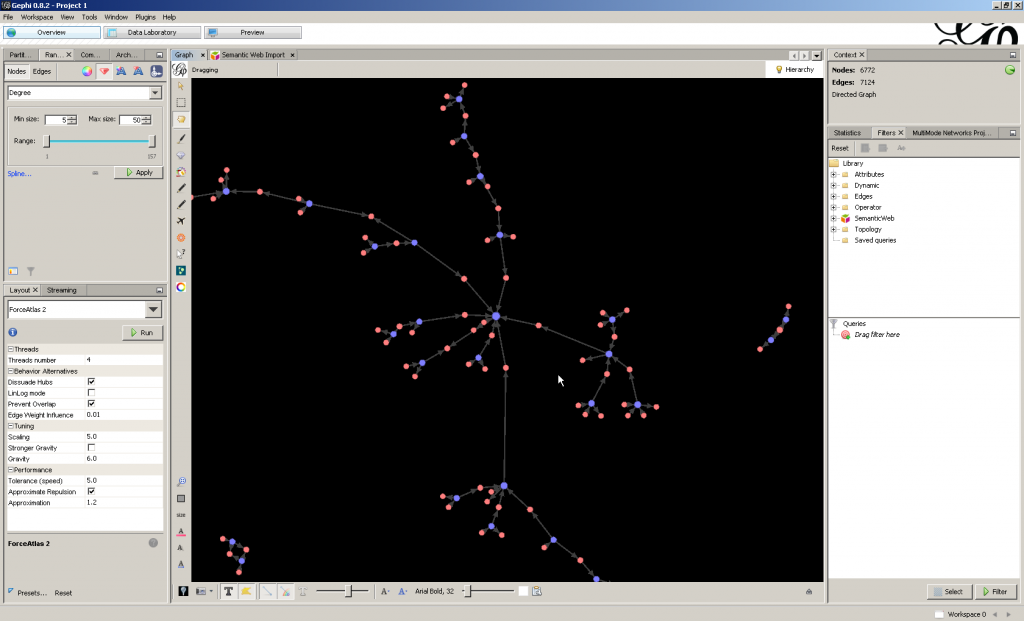
- Complete.bat for Windows or Complete.sh for Linux / OSX : Create a graph by representing in addresses, out addresses and transactions as node and relationship in addresses-[]-> transaction and transaction-[]-> out addresses.
- Simple.bat for Windows or Simple.sh for Linux / OSX : Same as before , but it will only represent in / out addresses as node and relationship in addresses-[]->out addresses.
- Watch your gephi and have fun.
Advise:
The complete script will generate graph that will makes Force Atlas I, II , 3D running kind of crazy with default parameters. It’s because the amplitude of edges weight (representing the number of µBTC ) can be very wide. To stabilize the layouts I can advise you to :
- (Force Atlas I) Put the property Maximum Displacement to 1 or lower (but not 0).
- (Force Atlas II / 3D) Put the property Edge Influence Weight to 0.2 or lower (0 is possible here).
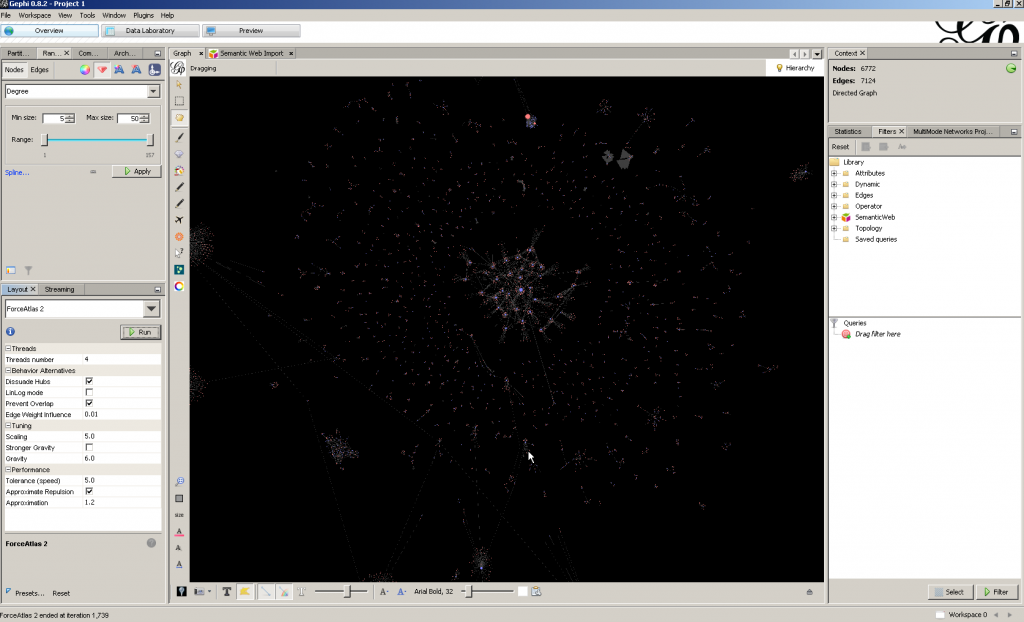
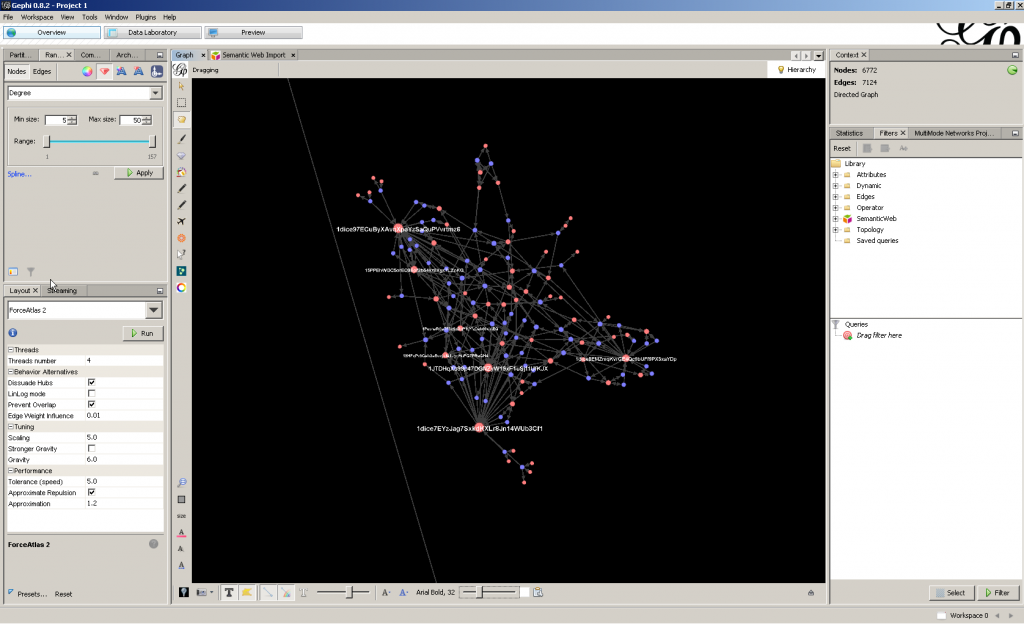
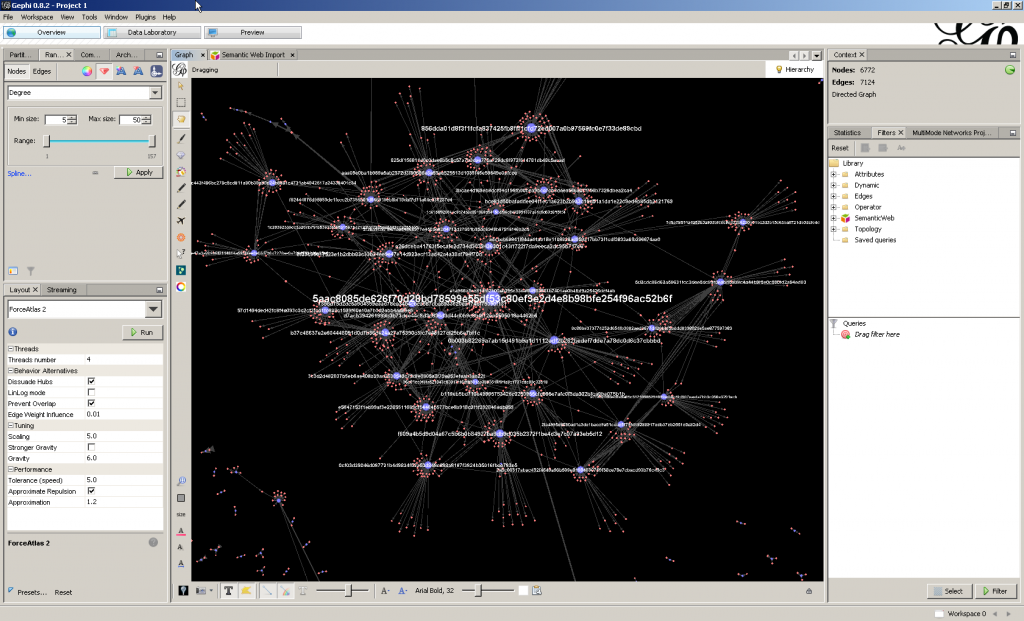
Here is some overviews :
- Red > Wallet / Address
- Blue > Transaction

